
The A100 is faster than the V100. But how much faster, and where does the gap come from?
Both generations support NVLink, both run PyTorch DDP, and both show up in academic HPC clusters. Getting clean numbers across the two is harder than it sounds: VRAM differences force different batch sizes, CUDA build constraints limit which PyTorch wheel you can install, and the comparison shifts depending on whether you care about peak throughput or multi-GPU scaling efficiency.
This post covers measured results from the same benchmark code on 8xV100 SXM2 16GB and 8xA100 SXM4 80GB, using two model architectures that stress the GPU and interconnect differently: ResNet-152 (compute-heavy CNN) and ViT-B/16 (communication-heavier transformer). The benchmark tool is open source and described in the portfolio entry. All results and code are at GitHub repository.
1. Why This Comparison Is Harder Than It Looks #
The obvious approach is to run the same batch size on both GPUs and compare throughput. That breaks immediately: V100 has 16 GB VRAM, A100 has 80 GB. The largest batch size that fits on V100 is far below what A100 can handle. Forcing A100 to use V100-constrained batch sizes would suppress its throughput artificially, and running V100 at OOM produces no result at all.
This benchmark separates the comparison into two parts.
Weak scaling efficiency compares how well each system scales from 1 to 8 GPUs, with per-GPU batch size fixed. This metric is normalized: it measures what fraction of 1-GPU throughput survives at N GPUs. A result of 95% at 8 GPUs means the system loses 5% of per-GPU throughput to DDP communication overhead. This comparison is valid even when the two systems use different batch sizes.
Absolute throughput compares raw images per second per GPU at each system’s maximum safe batch size. This is a “peak performance” comparison. It is not normalized, so the batch size difference is a real confounding variable. Treat it as “A100 at its best vs V100 at its best” rather than a controlled experiment.
Strong scaling is the most sensitive to batch size differences. The per-GPU batch shrinks as you add GPUs, so a GPU with less VRAM runs out of headroom faster. At V100’s memory limit (GBS=64), the 8-GPU run processes only 8 images per GPU per step, which puts the workload deep in the communication-dominated regime. The A100 results use GBS=512 and reach 64 images per GPU at 8 GPUs. These are not directly comparable, so strong scaling results are reported separately for each system.
2. Setup #
Hardware:
- 8xNVIDIA V100 SXM2 16GB (NVLink 2.0) on Lambda Cloud
- 8xNVIDIA A100 SXM4 80GB (NVLink 3.0) on Lambda Cloud
Software:
- V100: PyTorch 2.4.1, CUDA 12.6, Python 3.10
- A100: PyTorch 2.12.0, CUDA 13.0, Python 3.12
Note on PyTorch versions: Recent PyTorch wheels (cu130) no longer include sm_70, which is V100’s compute capability. The V100 requires an older wheel. This means throughput differences include a small PyTorch version component that cannot be fully controlled. Weak scaling efficiency comparisons are less sensitive to this because they are normalized within each system.
All runs use synthetic on-device data, torchrun for DDP, and the SGD optimizer. Each job runs a 60-second warmup followed by 300 to 600 seconds of measurement. Maximum safe batch sizes were found using find_max_bs.py:
| GPU | ResNet-152 fp16 | ViT-B/16 fp16 |
|---|---|---|
| V100 SXM2 16GB | 128 | 128 |
| A100 SXM4 80GB | 512 | 1024 |
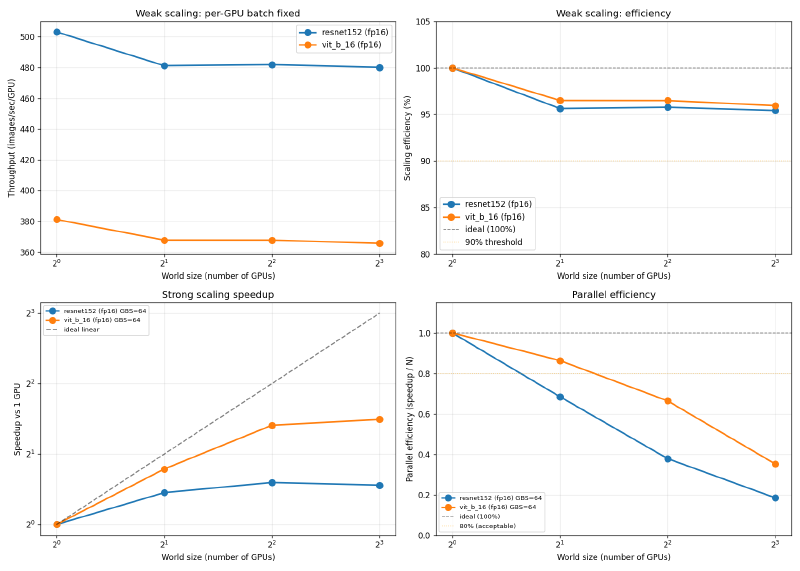
3. Weak Scaling Results #
Weak scaling holds per-GPU batch size fixed. Throughput per GPU should stay constant as more GPUs are added. Any drop is DDP communication overhead from NCCL gradient allreduce.
V100 SXM2 16GB, fp16, per-GPU BS=128:
| Model | 1 GPU | 2 GPU eff. | 4 GPU eff. | 8 GPU eff. |
|---|---|---|---|---|
| ResNet-152 | 503 img/s | 95.6% | 95.8% | 95.4% |
| ViT-B/16 | 381 img/s | 96.5% | 96.5% | 95.9% |
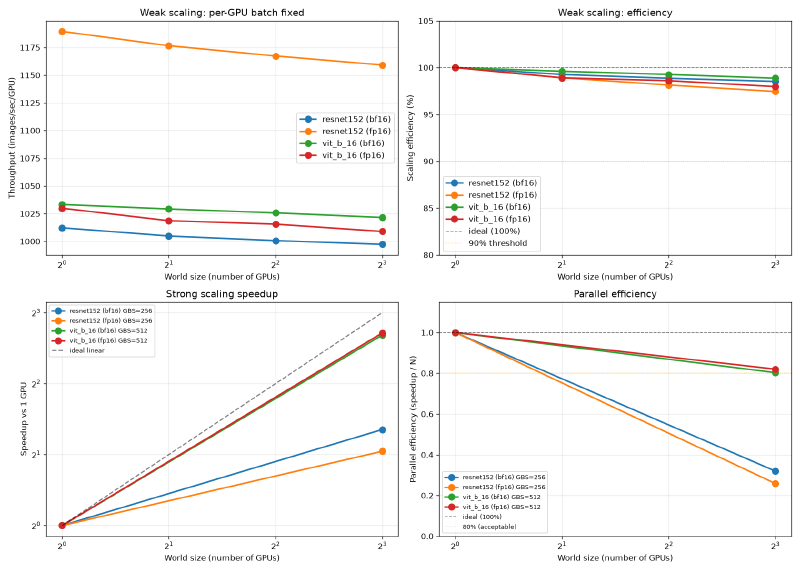
A100 SXM4 80GB, fp16:
| Model | Per-GPU BS | 1 GPU | 2 GPU eff. | 4 GPU eff. | 8 GPU eff. |
|---|---|---|---|---|---|
| ResNet-152 | 512 | 1190 img/s | 98.9% | 98.1% | 97.4% |
| ViT-B/16 | 1024 | 1030 img/s | 98.9% | 98.6% | 98.0% |
A100 SXM4 80GB, bf16:
| Model | Per-GPU BS | 1 GPU | 2 GPU eff. | 4 GPU eff. | 8 GPU eff. |
|---|---|---|---|---|---|
| ResNet-152 | 512 | 1012 img/s | 99.3% | 98.9% | 98.5% |
| ViT-B/16 | 1024 | 1033 img/s | 99.6% | 99.3% | 98.9% |
Both systems scale well. V100 reaches 95 to 96% at 8 GPUs; A100 reaches 97 to 99%. The 2 to 3 percentage point difference reflects NVLink 3.0 (600 GB/s bidirectional) vs NVLink 2.0 (300 GB/s bidirectional). At the batch sizes used here, V100 spends a slightly larger fraction of each step waiting on gradient synchronization.
Absolute throughput comparison (fp16, each GPU at its max batch size):
| Model | V100 1-GPU | A100 1-GPU | Ratio |
|---|---|---|---|
| ResNet-152 | 503 img/s | 1190 img/s | 2.37x |
| ViT-B/16 | 381 img/s | 1030 img/s | 2.70x |
A100 delivers roughly 2.4x more throughput for ResNet-152 and 2.7x for ViT-B/16. The larger gap for ViT reflects A100’s improved Tensor Core throughput for GEMM-heavy operations and better memory bandwidth (2.0 TB/s vs 0.9 TB/s on V100).
4. fp16 vs bf16 on A100 #
A100 supports both fp16 and bf16 in hardware. Both formats use 2 bytes per value, so VRAM usage is identical. The performance difference comes from the compute path.
| Model | fp16 | bf16 | Gap |
|---|---|---|---|
| ResNet-152 | 1190 img/s | 1012 img/s | fp16 is 17% faster |
| ViT-B/16 | 1030 img/s | 1033 img/s | no meaningful difference |
ResNet-152 runs 17% faster in fp16. ViT-B/16 shows no difference. The reason is memory layout: ResNet uses channels_last (NHWC) format, which cuDNN’s convolution kernels handle differently per precision. The fp16 NHWC path on A100 is more optimized than bf16. ViT-B/16 does not use channels_last because attention is not a convolution, so the precision difference does not interact with memory layout.
This means the “use bf16 on Ampere” advice common in transformer training literature does not automatically transfer to CNN workloads. For ResNet-scale models, fp16 is the faster choice on A100.
5. Strong Scaling Results #
Strong scaling fixes global batch size and measures how much faster the job finishes with more GPUs. Ideal speedup is N for N GPUs.
Direct comparison is not valid here. V100 and A100 use different GBS values because V100’s VRAM constrains the 1-GPU baseline. The tables below show each system independently.
V100 SXM2 16GB, fp16, GBS=64 (per-GPU shrinks from 64 to 8 at 8 GPUs):
| Model | 1 GPU | 8 GPU speedup | 8 GPU efficiency |
|---|---|---|---|
| ResNet-152 | 461 img/s | 1.47x | 18.4% |
| ViT-B/16 | 367 img/s | 2.81x | 35.1% |
A100 SXM4 80GB, fp16, GBS=512 (per-GPU shrinks from 512 to 64 at 8 GPUs):
| Model | 1 GPU | 8 GPU speedup | 8 GPU efficiency |
|---|---|---|---|
| ResNet-152 | 961 img/s | 2.55x | 31.9% |
| ViT-B/16 | 1061 img/s | 6.42x | 80.3% |
Strong scaling efficiency collapses when per-GPU batch size gets small. At V100 GBS=64 with 8 GPUs, each card processes 8 images per step. The gradient allreduce takes longer than the forward and backward pass combined at that size. ResNet-152 on V100 reaches 18.4% at 8 GPUs: adding 7 more GPUs delivers only 1.47x speedup on a job that ideally would be 8x faster.
ViT-B/16 fares better (35.1% on V100, 80.3% on A100) because ViT’s per-step compute is heavier than ResNet at the same batch size. More computation overlaps with communication, so the synchronization wait is a smaller fraction of each step.
6. What the Numbers Mean #
Both systems scale cleanly in weak scaling (above 95% at 8 GPUs). The question is whether the cost difference justifies the throughput difference.
A100 delivers 2.4 to 2.7x more throughput per GPU. If Lambda’s A100 pricing is less than 2.4x the V100 price, A100 gives better cost efficiency per trained sample. If your workload requires a large global batch size and you need strong scaling to help it finish faster, A100 has a significant structural advantage: its larger VRAM maintains efficient per-GPU batch sizes at higher GPU counts, while V100 runs out of headroom quickly.
If your workload fits in 16 GB per GPU and you are running weak scaling across many nodes, V100 at 95% efficiency may be cost-effective depending on price.
7. Troubleshooting #
CUDA error: no kernel image is available for execution on the device on V100
Recent PyTorch wheels (cu130, cu128) do not include sm_70 (V100). Install cu126 instead:
pip install torch torchvision --index-url https://download.pytorch.org/whl/cu126
python -c "import torch; print(torch.cuda.get_arch_list())"
# Confirm sm_70 appears in the output
OOM on 1-GPU strong scaling baseline
The 1-GPU strong scaling run uses per-GPU BS = GBS. If GBS exceeds your GPU’s safe batch size, it will OOM before the multi-GPU runs. Use find_max_bs.py to find the ceiling and set GBS at or below it:
python find_max_bs.py --model resnet152 --precision fp16High step-time variance warning from analyze_results.py
This is expected when per-GPU batch size is very small (strong scaling at high GPU counts). The GPU is communication-bound and step timing becomes irregular. It can be safely ignored for the communication-overhead analysis; it is only a concern if variance appears in weak scaling results at large batch sizes.
8. Summary #
Three takeaways from this benchmark.
Both V100 and A100 scale well in weak scaling, exceeding 95% efficiency at 8 GPUs. The 2 to 3 percentage point gap between the two reflects NVLink 3.0 vs NVLink 2.0 bandwidth, not a fundamental difference in scaling behavior.
A100 delivers 2.4x more throughput for ResNet-152 and 2.7x for ViT-B/16 at each system’s maximum batch size. Memory bandwidth and Tensor Core throughput both contribute, with the larger gap for ViT reflecting A100’s advantage in GEMM-heavy workloads.
On A100, fp16 outperforms bf16 by 17% for ResNet-152 due to more optimized cuDNN NHWC convolution kernels. ViT-B/16 shows no difference between the two precisions. The common advice to “use bf16 on Ampere” does not transfer to CNN workloads without verification.
All benchmark scripts, raw JSON results, and plots are in the GitHub repository.
Happy Computing!